
2015 Market Trend Report – Spanos Park Stockton
Below are the 2015 Real Estate Market Trend Reports for the Spanos Park neighborhoods in Stockton. Use these visuals to determine if now is a good time to buy and/or the sell. Contact Bob Peralta for help in selling your property in Spanos Park or for helping in buying a home in Spanos Park East and West. Do you need help in understanding the real estate market. We are here to help you. Just give us a call – (209) 957-1858
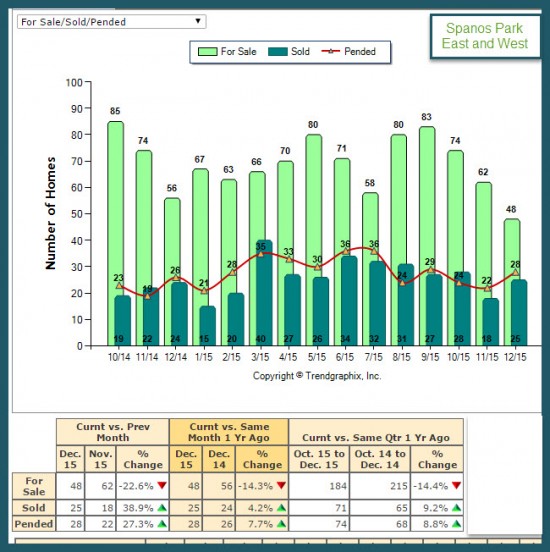
Spanos Park Market Trend Report For Sale vs Sold 2015
The above is the Real Estate Market Trend Report for Spanos Park East and West for the Average Number of Homes for Sale vs Sold for 2015. As you can see from the above chart, there were only 48 homes for sale in Spanos Park East and West at the end of December 2015. That compares to 56 for sale at the end of December 2014. That’s a 14.3 decrease.
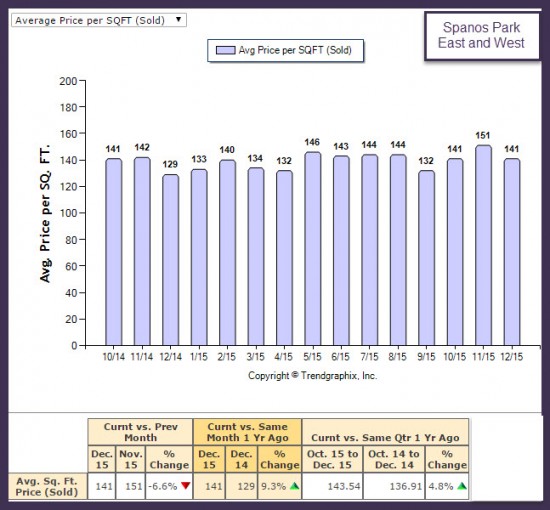
Spanos Park Market Trend Reports Ave Price Per Sq Ft 2015
The above is the Real Estate Market Trend Report for Spanos Park East and West for Average Price per Square Foot for 2015. As you can see from the above chart, the average price per square foot in Spanos Part East and West at the end of December 2015 was $141. That compares to $129 at the end of December 2014. That’s a 9.3% increase.
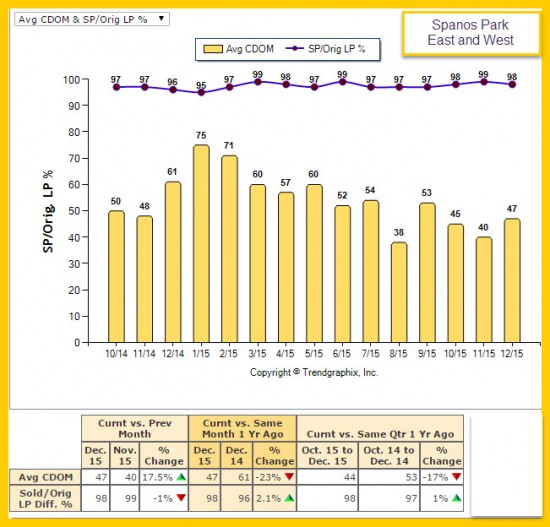
Spanos Park Market Trend Reports Days on the Market 2015
The above is the Real Estate Market Trend Report for Spanos Park East and West for Average Days on the Market and the Listing Price vs Sale Price for 2015. As you can see from the chart above, the average days on the market at the end of December 2015 was 47. That compares to 61 at the end of December 2014. That’s a 23% decrease in the length of time it took to sell a house in Spanos Park East and West.
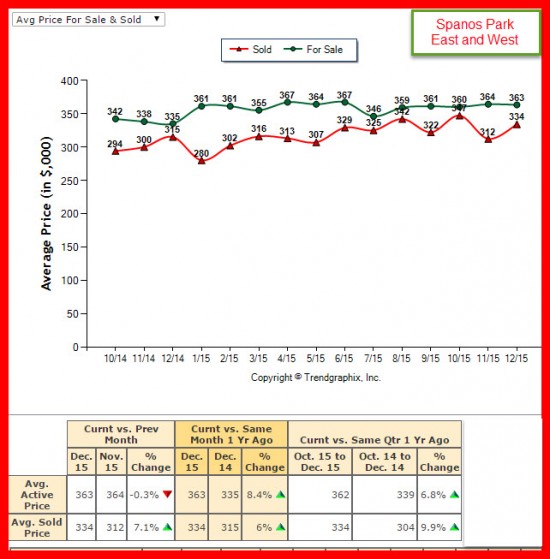
Spanos Park Market Trend Reports Avg Price for Sale and Sold 2015
The above is the Real Estate Market Trend Report for Spanos Park East and West for the Average Price for Sale and Sold for 2015. As you can see from the above chart, the average price of the homes for sale in Spanos Park at the end of December 2015 was $363,000. The average price for the sold homes at the end of December 2015 was $334,000. Compared to December 2014 that is a 8.4% increase for the average price on homes for sale, and a 6.0% increase in the average sold price.
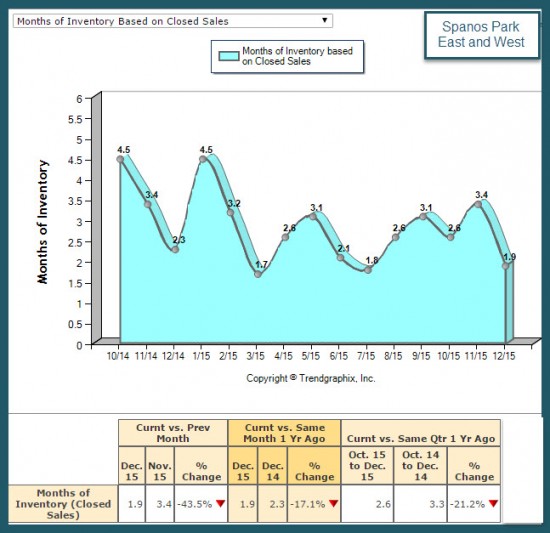
Spanos Park Market Trend Reports Months of Inventory 2015
The above is the Real Estate Market Trend Report for Spanos Park East and West for the Months of Inventory for 2015. As you can see the months of inventory for the Spanos Park Neighborhoods of Stockton thru December 2015 average was only 1.9 months. That compares to 2.3 at the end of December 2014. That’s a decrease of 17.1%
After reviewing these 2015 Spanos Park Real Estate Market Trend Reports, if you have questions or want advice, give Bob Peralta a call – (209) 957-1858. Follow this link for the MLS listings of Current Homes for Sale in Spanos Park East and West.
Bob Peralta
Managing Broker/Realtor
Bob Peralta Properties
(209) 957-1858
BRE 00913523
